On Monday, the Association for Financial Professionals issuedits “2013 AFPEstimating and Applying Cost of Capital Survey Report.” Thesurvey of 424 finance professionals found that although financialplanning and analysis (FP&A) might be the department that makesthe most use of weighted average cost of capital (WACC) figures, itis generally not the department responsible for coming up with WACCestimates. In 46 percent of respondents' companies, treasury isresponsible for WACC calculations. This responsibility falls tofinance in 32 percent of companies and to FP&A in only 18percent.
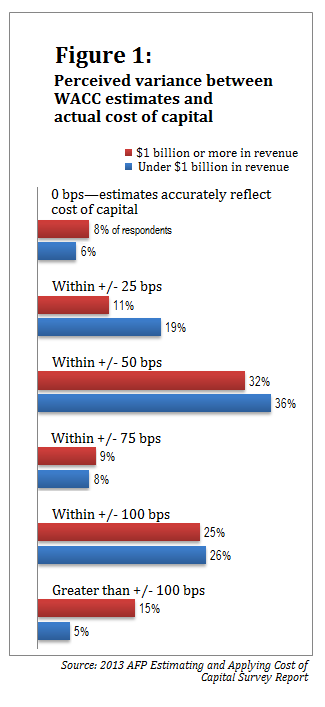
|More than half of respondents think their organization's WACCestimate is within 50 basis points (bps) of its actual cost ofcapital, but 11 percent believe the WACC is off by more than 100bps. Large companies are three times as likely to think their WACCcalculations are more than 1 percentage point away from actual costof capital (see Figure 1).
|
The survey delved into the calculations companies use to reachtheir WACC estimates. It found that the vast majority of companies(85 percent) use discounted cash flow (DCF) techniques to valuetheir projects and investment opportunities; most of the remaining15 percent of respondents use either projected return on investment(ROI) or a more generic means of cost-benefit analysis. Most DCFusers (51 percent) discount explicit forecasted cash flows over theproject's first five years. Twenty-six percent use a 10-yearexplicit cash flow forecast, only 3 percent use a 15-year forecast,and 12 percent use a three-year forecast.
|Following their explicit discounted cash flow forecasting,respondents most commonly estimate the terminal or continuing valueof the project or investment opportunity using a perpetuity growthmodel (42 percent). Thirty-seven percent use a long explicit cashflow forecast (most popular among smaller and privately heldcompanies), and 15 percent use the value driver model.
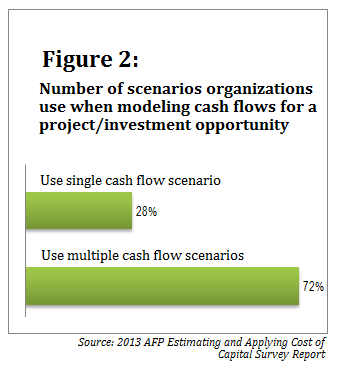
|The survey also found that nearly three-quarters of respondentsconsider multiple scenarios (e.g., best-case, worst-case, andexpected-case scenarios) when modeling cash flows for projects andinvestment opportunities (see Figure 2).
|
The survey also explored how companies estimate their cost ofequity. Eighty-five percent of respondents use the Capital AssetPricing Model (CAPM); only 4 percent use the Dividend DiscountModel (DDM), and 2 percent use the Arbitrage Pricing Model(APM).
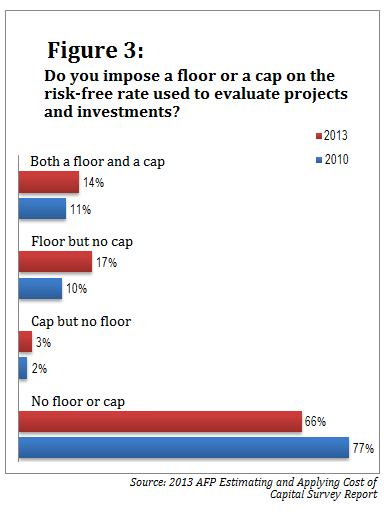
|Among those that use the CAPM, the most popular instrument usedin estimating risk-free rates is the 10-year Treasury (39 percent),followed by 90-day Treasuries (17 percent), 5-year Treasuries (14percent), and 52-week Treasuries (12 percent). An increasing numberof companies are imposing a floor, a cap, or both on the risk-freerate they use in evaluating projects and investments (see Figure3). Among these, the average floor for the risk-free interest rateis 4 percent. The average rate cap is 8 percent, although theaverage among companies with less than $1 billion in annual revenueis 10 percent and the average among larger companies is 7percent.
|
To determine the beta factor in estimating their cost of equity,nearly two-thirds of companies use Bloomberg data. Half use a rawbeta factor, while the other half use an adjusted beta factor. Thisis a notable shift toward using raw beta; in 2010, considerablymore respondents used adjusted beta (57 percent).
|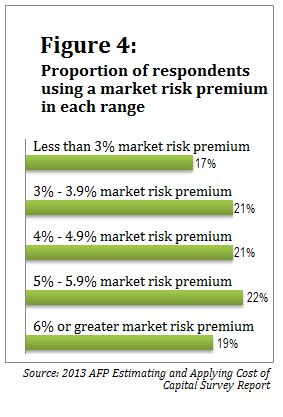
When asked about the market risk premium they use to determineexpectations for return on an equity portfolio, roughly equalnumbers use a premium of less than 3 percent, a premium of 6percent or higher, and each full percentage in between the two (seeFigure 4). The most common frequency of re-evaluating the marketrisk premium is once a year (36 percent of respondents), although19 percent re-evaluate on a quarterly basis and 23 percentreconsider their market risk premium every time they estimate theircost of equity.
|In figuring the cost-of-debt component of their WACC, 43 percentof respondents' companies use the current rate on their outstandingdebt, 21 percent use the forecasted rate for new debt issuance, 21percent use an average rate on outstanding debt over a definedperiod of time, and 12 percent use the historical rate onoutstanding debt. The survey also inquired about which tax raterespondents use when calculating the after-tax cost of debt. Almosttwo-thirds (60 percent) use the effective tax rate, while more thana quarter (27 percent) use the marginal tax rate.
|How do companies pull together all these calculations todetermine their WACC? In establishing the relative weighting ofdebt and equity, 36 percent use their current book debt-to-equityratio. Seventeen percent use their current book debt but use marketvalues for the equity portion of the ratio. Twenty-four percent usetheir current market debt-to-equity ratio, while 18 percent usetheir target debt-to-equity ratio.
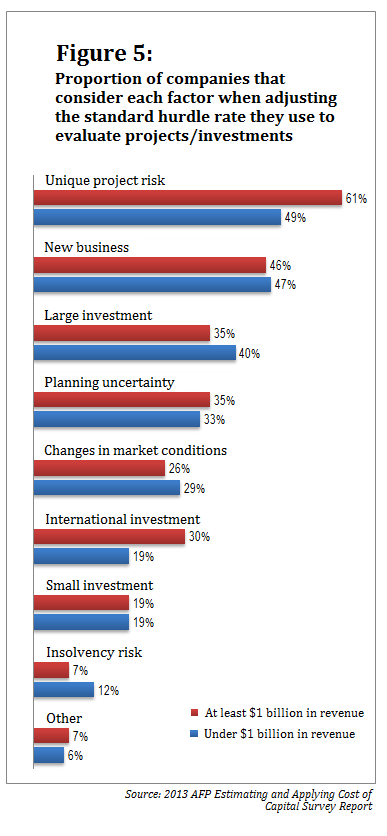
|Ultimately, when determining whether to fund a specific project,48 percent of large companies and 32 percent of smaller businessesuse a standard hurdle rate above the WACC. Then many adjust thehurdle rate when characteristics of the project indicate that doingso is appropriate (see Figure 5).
|
Complete your profile to continue reading and get FREE access to Treasury & Risk, part of your ALM digital membership.
Your access to unlimited Treasury & Risk content isn’t changing.
Once you are an ALM digital member, you’ll receive:
- Critical Treasury & Risk information including in-depth analysis of treasury and finance best practices, case studies with corporate innovators, informative newsletters, educational webcasts and videos, and resources from industry leaders.
- Exclusive discounts on ALM and Treasury & Risk events.
- Access to other award-winning ALM websites including PropertyCasualty360.com and Law.com.
*May exclude premium content
Already have an account? Sign In
© 2024 ALM Global, LLC, All Rights Reserved. Request academic re-use from www.copyright.com. All other uses, submit a request to [email protected]. For more information visit Asset & Logo Licensing.