Ten years after the credit crisis, and with the Federal Reserveraising rates eight times since 2015, the end game is fastapproaching. As the U.S. economy has strengthened, the effect ofrate increases on the yield curve has been uneven, resulting inspeculation about prospects for a yield-curve inversion.Macroeconomic factors like trade policy, emerging-marketsvolatility, and quantitative easing in Europe further complicatethe landscape.
|Everyone seems to have a view about the future, although whichview is prevailing changes regularly. One thing is clear, however:Further rate increases are very likely. We don't know how many, forhow long, or what their effect on the yield curve may be. However,corporate treasury and finance professionals can use scenarioanalysis and simulations to assess the impact of the Fed's interestrate end game.
||
End of the “New Normal”
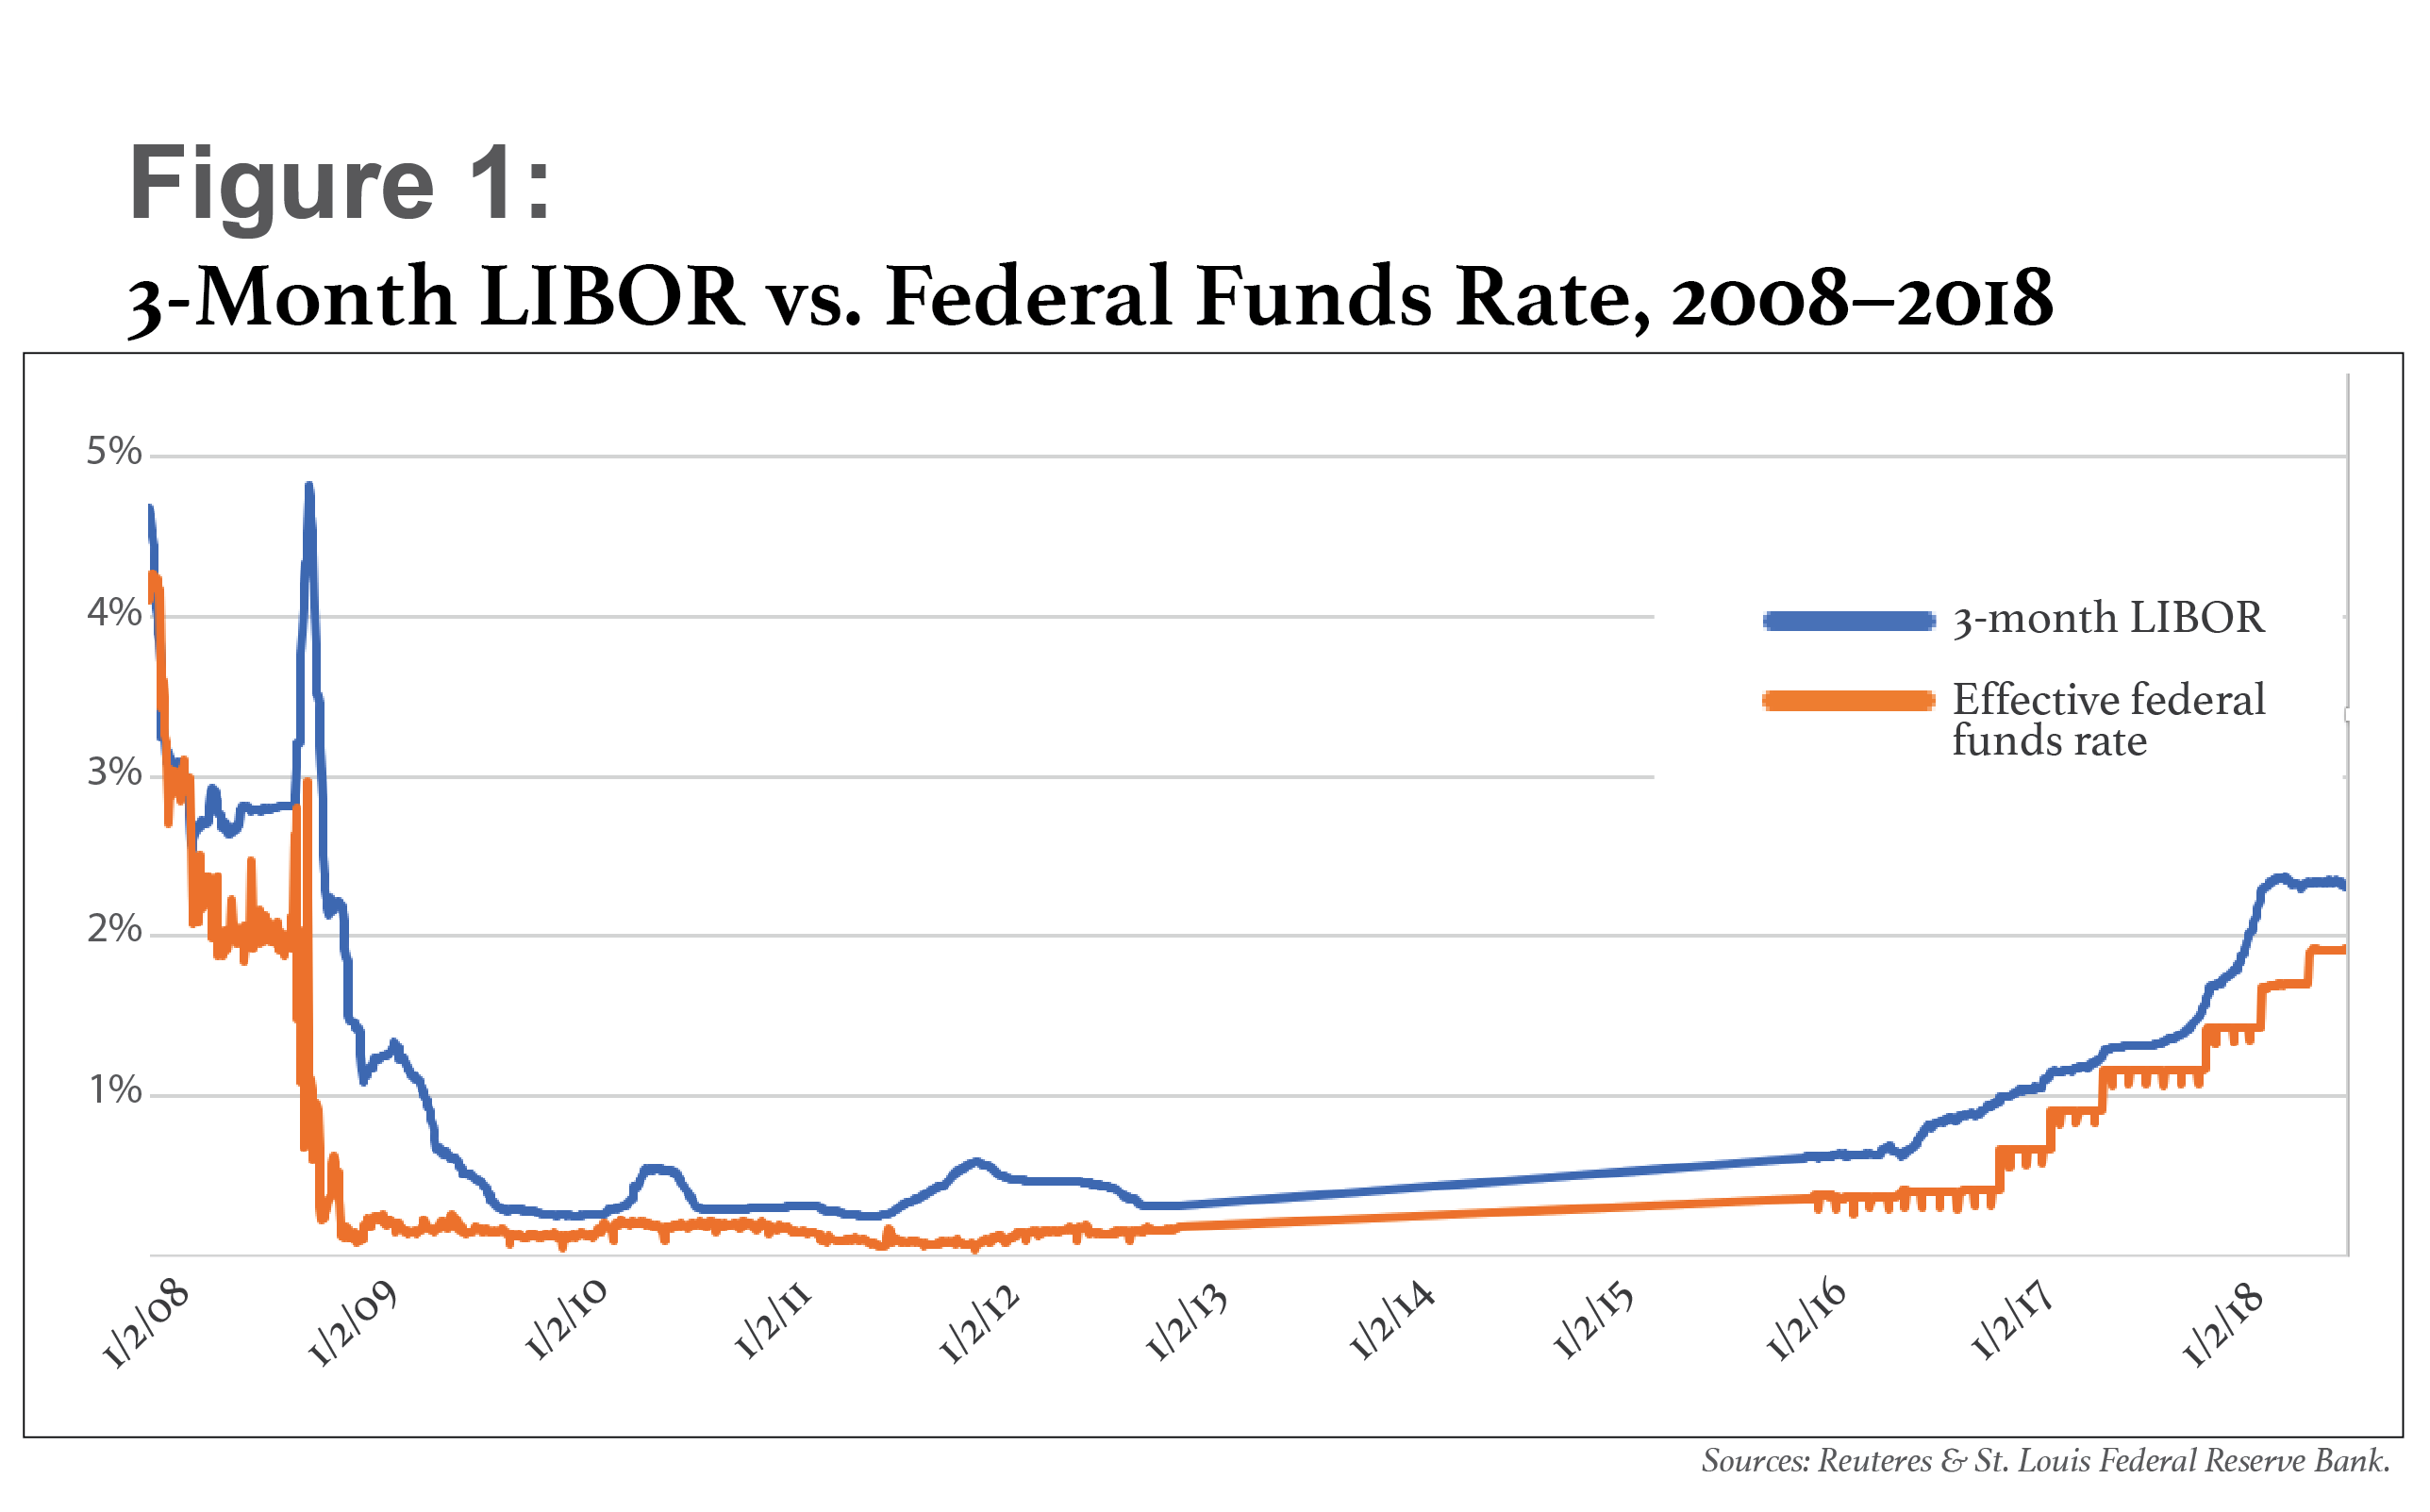
Figure 1 compares historical three-month LIBOR (LondonInter-bank Offered Rate) levels with the effective federal fundsrate. It shows that—historically and, especially, morerecently—LIBOR rates track with movements in the federal fundsrate. Therefore, Federal Reserve policy and future fed funds ratesare useful guides to future LIBOR rates.
|
Consider the case of a typical U.S. corporate that entered intoa revolving floating-rate line of credit (three-month LIBOR, plus150 basis point credit spread) a few years ago and is due to renewthe credit line in a year.
|Assuming the line was mostly drawn and prudently hedged atinception, how should the treasury team go about assessing theimpact of interest rate movement on their future funding costs ifthey expect the credit line to roll at maturity on similar terms?They should take a systematic approach that combines scenario andsimulation analysis.
|Figure 2, below, illustrates a simple use case, representing athree-year $500 million floating-rate facility that was establishedin 2017 and that matures at the end of 2019. The light-blue barsindicate the total credit line available, while the medium-bluebars show that the facility is almost 75 percent utilized—with $370million drawn—through maturity. At the facility's inception, thecompany hedged $220 million with a receive-floating-pay-fixedinterest rate swap and had $100 million in fixed-rate loans, asindicated by the dark-blue bars.
|In December 2019, the credit facility will mature, and thetreasury team assumes it will roll over on similar terms, toanother three-year floating-rate term. The company plans to drawdown another $30 million at that time, so it will be utilizing 80percent of the facility. It will also roll the $100 million offixed-rate loans.
|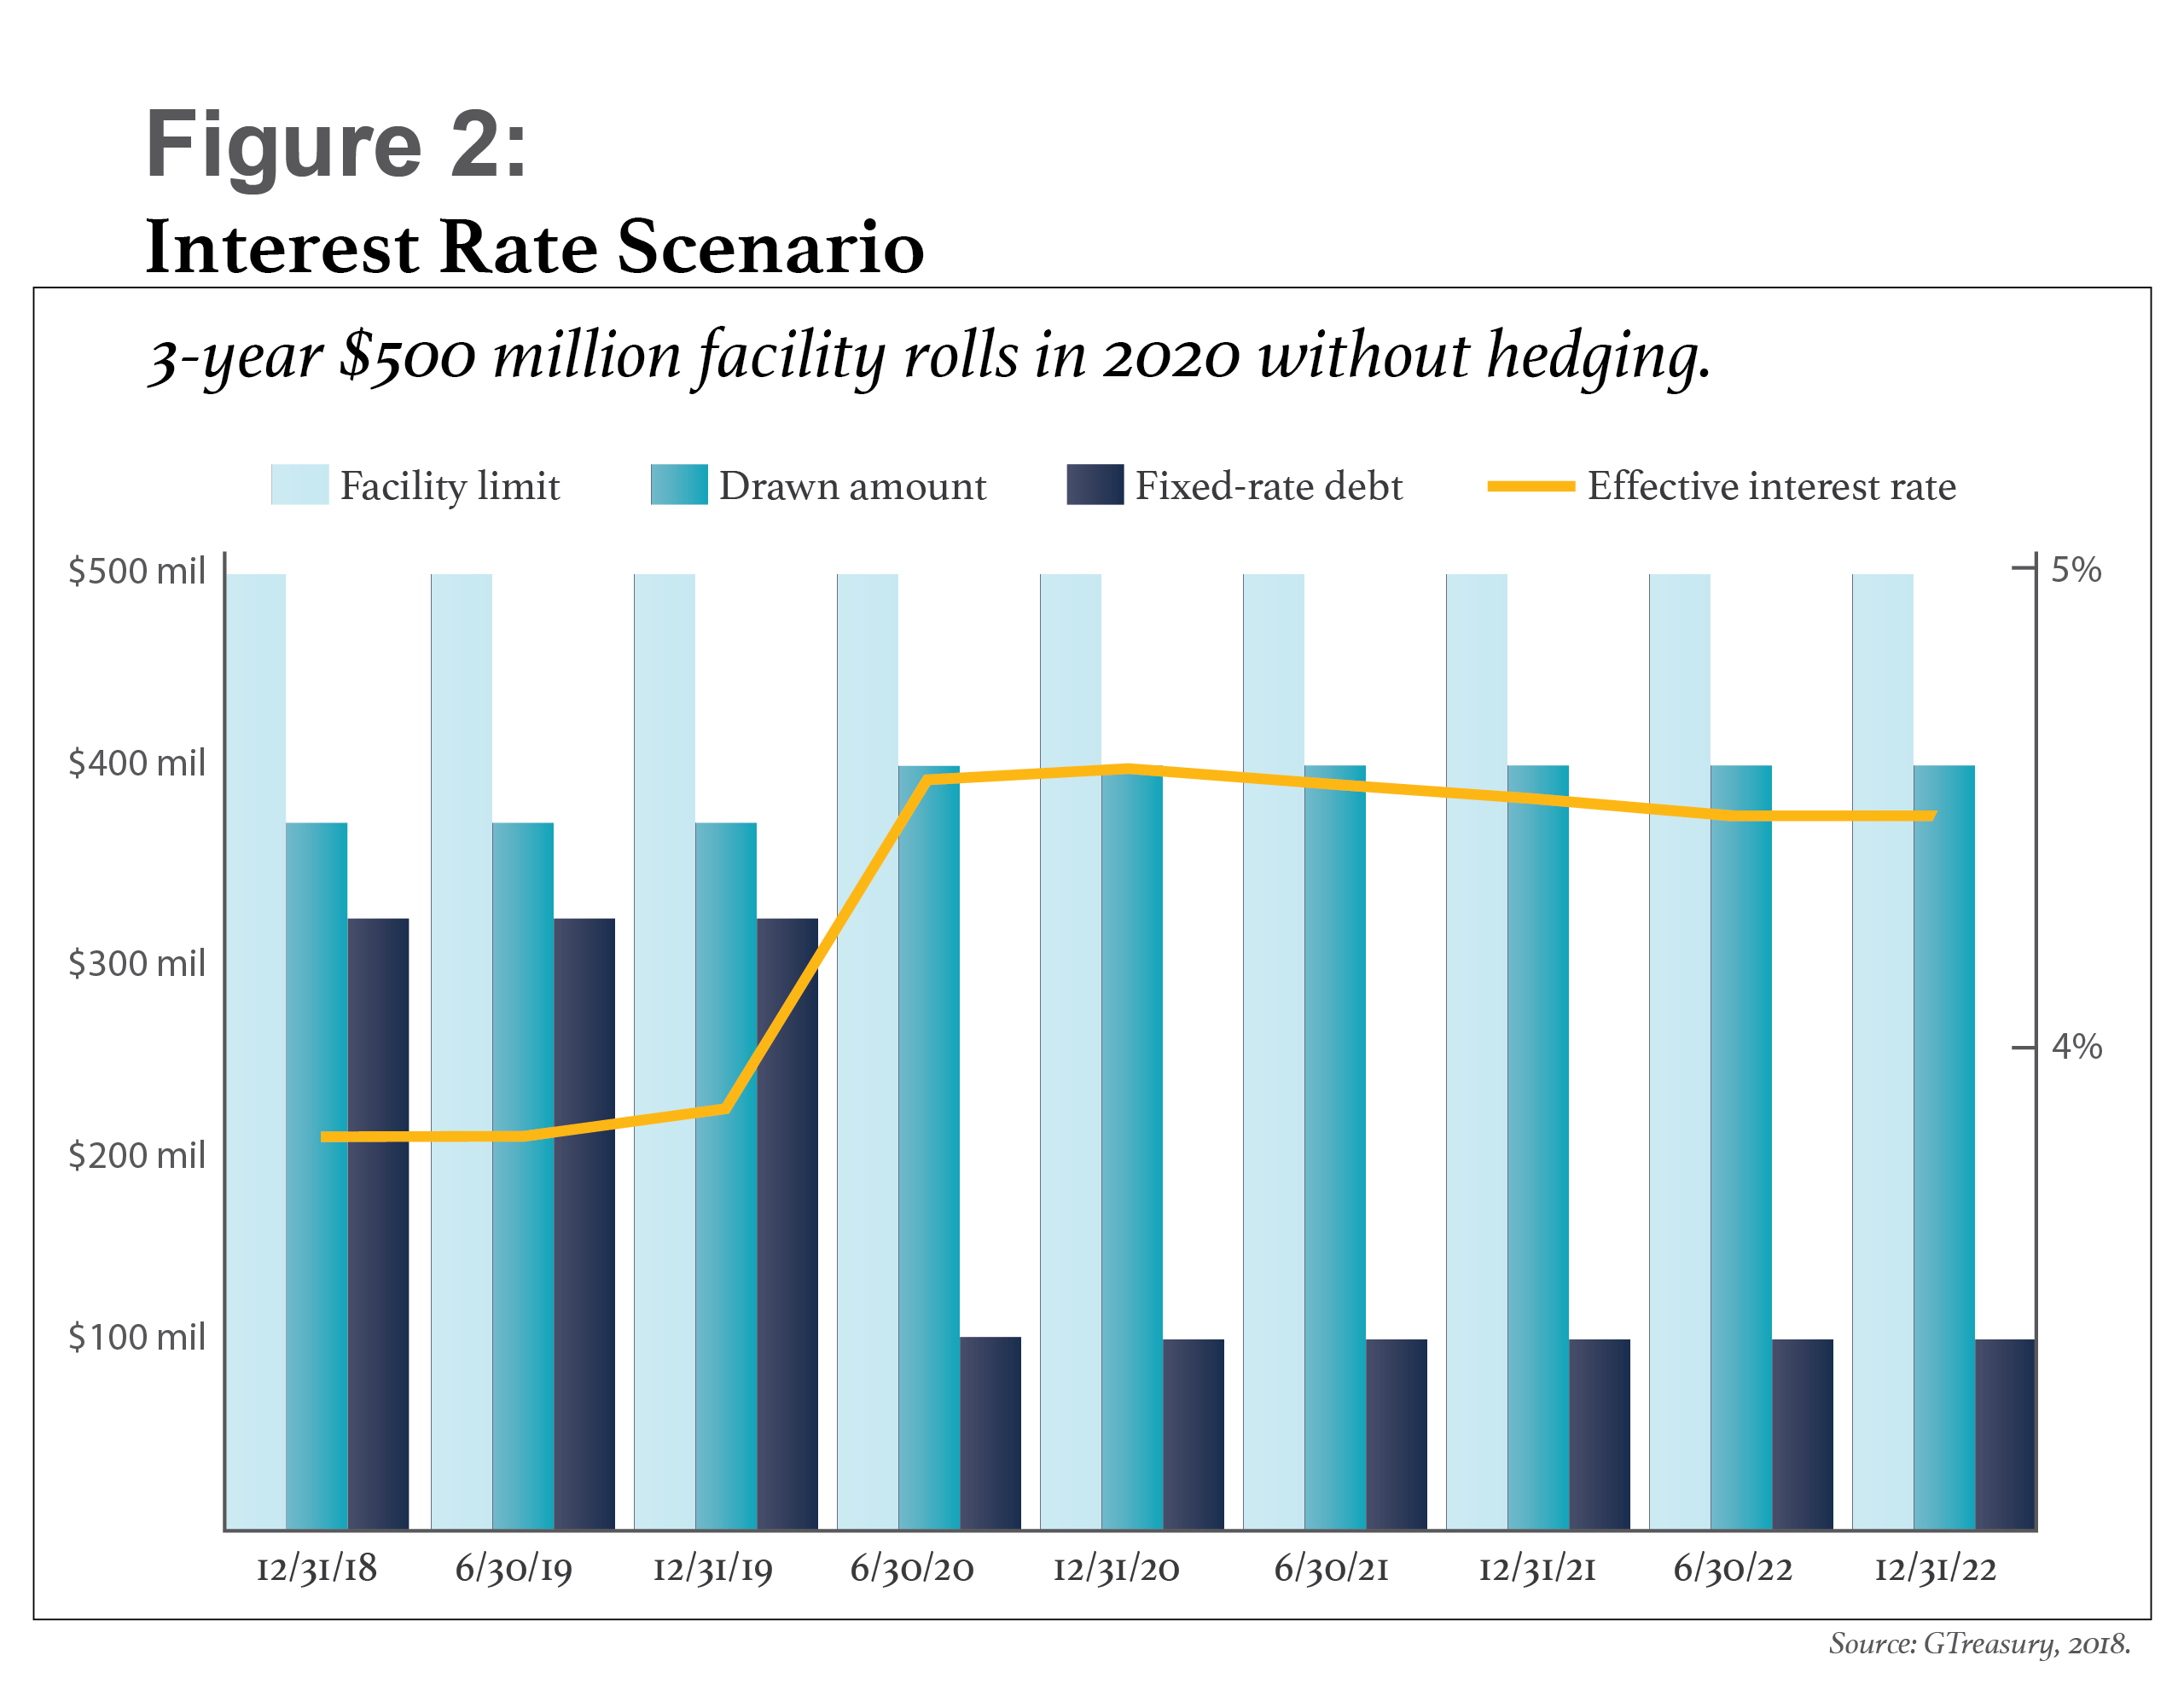
Through December 2019, the end of the $220 million hedge, theeffective interest rate on the credit facility—as indicated by theyellow line—hovers between 3.8 percent and 3.9 percent. But becausemost of the facility is no longer hedged after December 2019, theeffective rate jumps up in 2020 to 4.6 percent and remains nearthat level through the full term of the new credit facility.
|Confronted with this situation, the company's treasury teamneeds to assess what the effective interest rates on the newfacility might be if the market moves in the next 18 months.Analyzing the impact of possible scenarios may shed light on this.Some observations:
- Effective rates are stable until maturity of the facility atthe end of 2019. This is due to the hedge the company has put inplace.
- The market has moved significantly since the initial hedge wasput in place in 2017. Thus, a significant increase in effectiverates will occur in 2020, regardless of the size of hedge thecompany adopts—i.e., jumping from 3.9 percent to 4.6 percent. Thisis inescapable.
- Further increases in effective rates will occur if the LIBORrates increase more in the next 18 months, which will happen if theFed continues to raise federal funds rates.
|
Calculating the Impact of Different Possible Interest RateOutcomes
A market scenario planning exercise should consider the effectof a number of likely future states for interest rates. Fourpossible scenarios to consider for the three-month LIBOR are:
- Market. Current rates continue(benchmark).
- Market + 1%. Rates increase by 100basis points (bps) evenly across the curve.
- Yield curve inversion. Rates increasemore at the short end (around 100 bps), such that the curve beginsto slope downward, for an inverted yield curve.
- Credit crisis. Rates rise toextremely high levels, very quickly—the worst-case scenario.
In a recent webinar poll, 29 percent of respondents expectedcredit-crisis rates to return, and more than 55 percent expected arate increase of 50 bps to 100 bps.
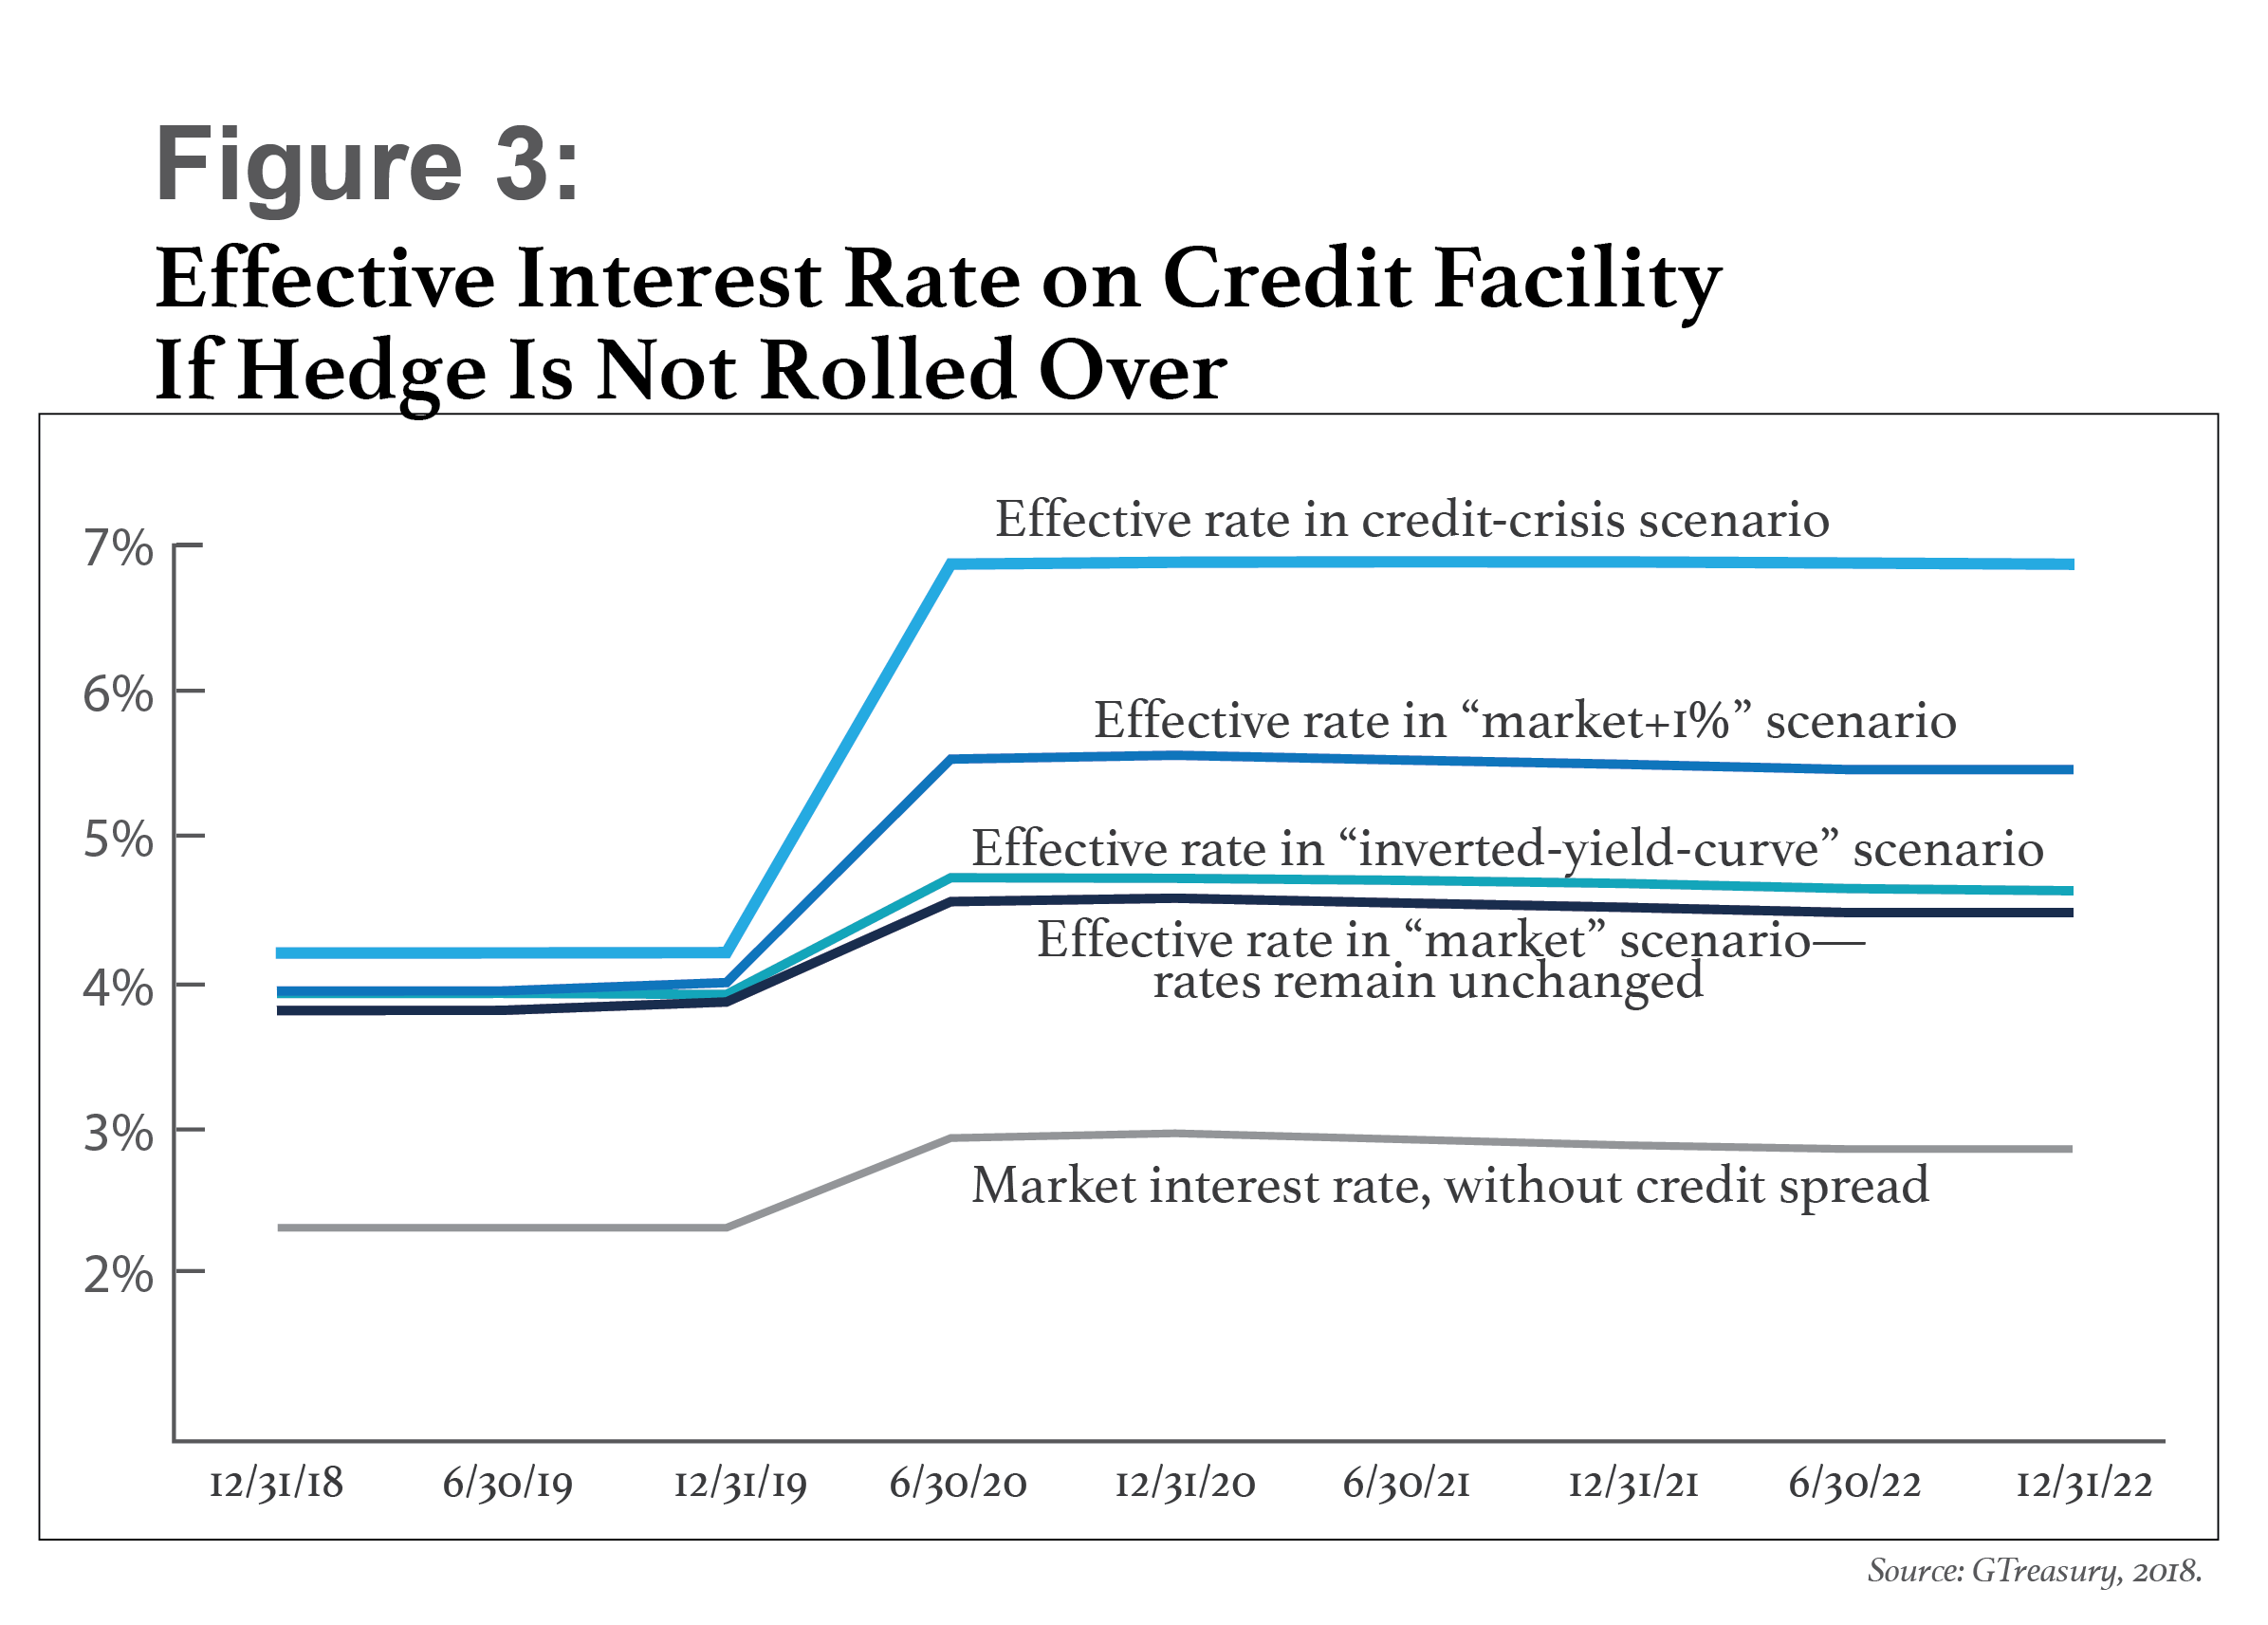
|Figure 3 shows how the credit facility in our example wouldrespond to each of the four scenarios described above. Everyscenario results in a higher effective interest rate once thefacility rolls over. This is unavoidable. However, if the facilityis left unhedged, the actual interest rate paid (the effectiverate) will vary widely, depending on the Fed's action. The bluelines on Figure 3 represent the effective rate—including the 150bps credit spread—that the company would pay for the unhedgedcredit facility under each scenario. For reference, the gray lineshows the effective rate under current market conditions excludingthe credit spread.
|
After evaluating likely effective interest rates in an unhedgedscenario, the treasury team should look at the effective interestrates they would pay if they hedged the facility. This informationcan come from the company's banks, or treasury can use Bloomberg orReuters to get published forward-starting swap rates. In ourexample, the company is considering entering into aforward-starting hedge for the term of the rolled facility. Thiswould be a continuation of the original swap—a three-yearreceive-floating-pay-fixed interest rate swap, for the samenotional value ($220 million) as the original swap. Figure 4 showsthe effective rate in each of our four scenarios.
|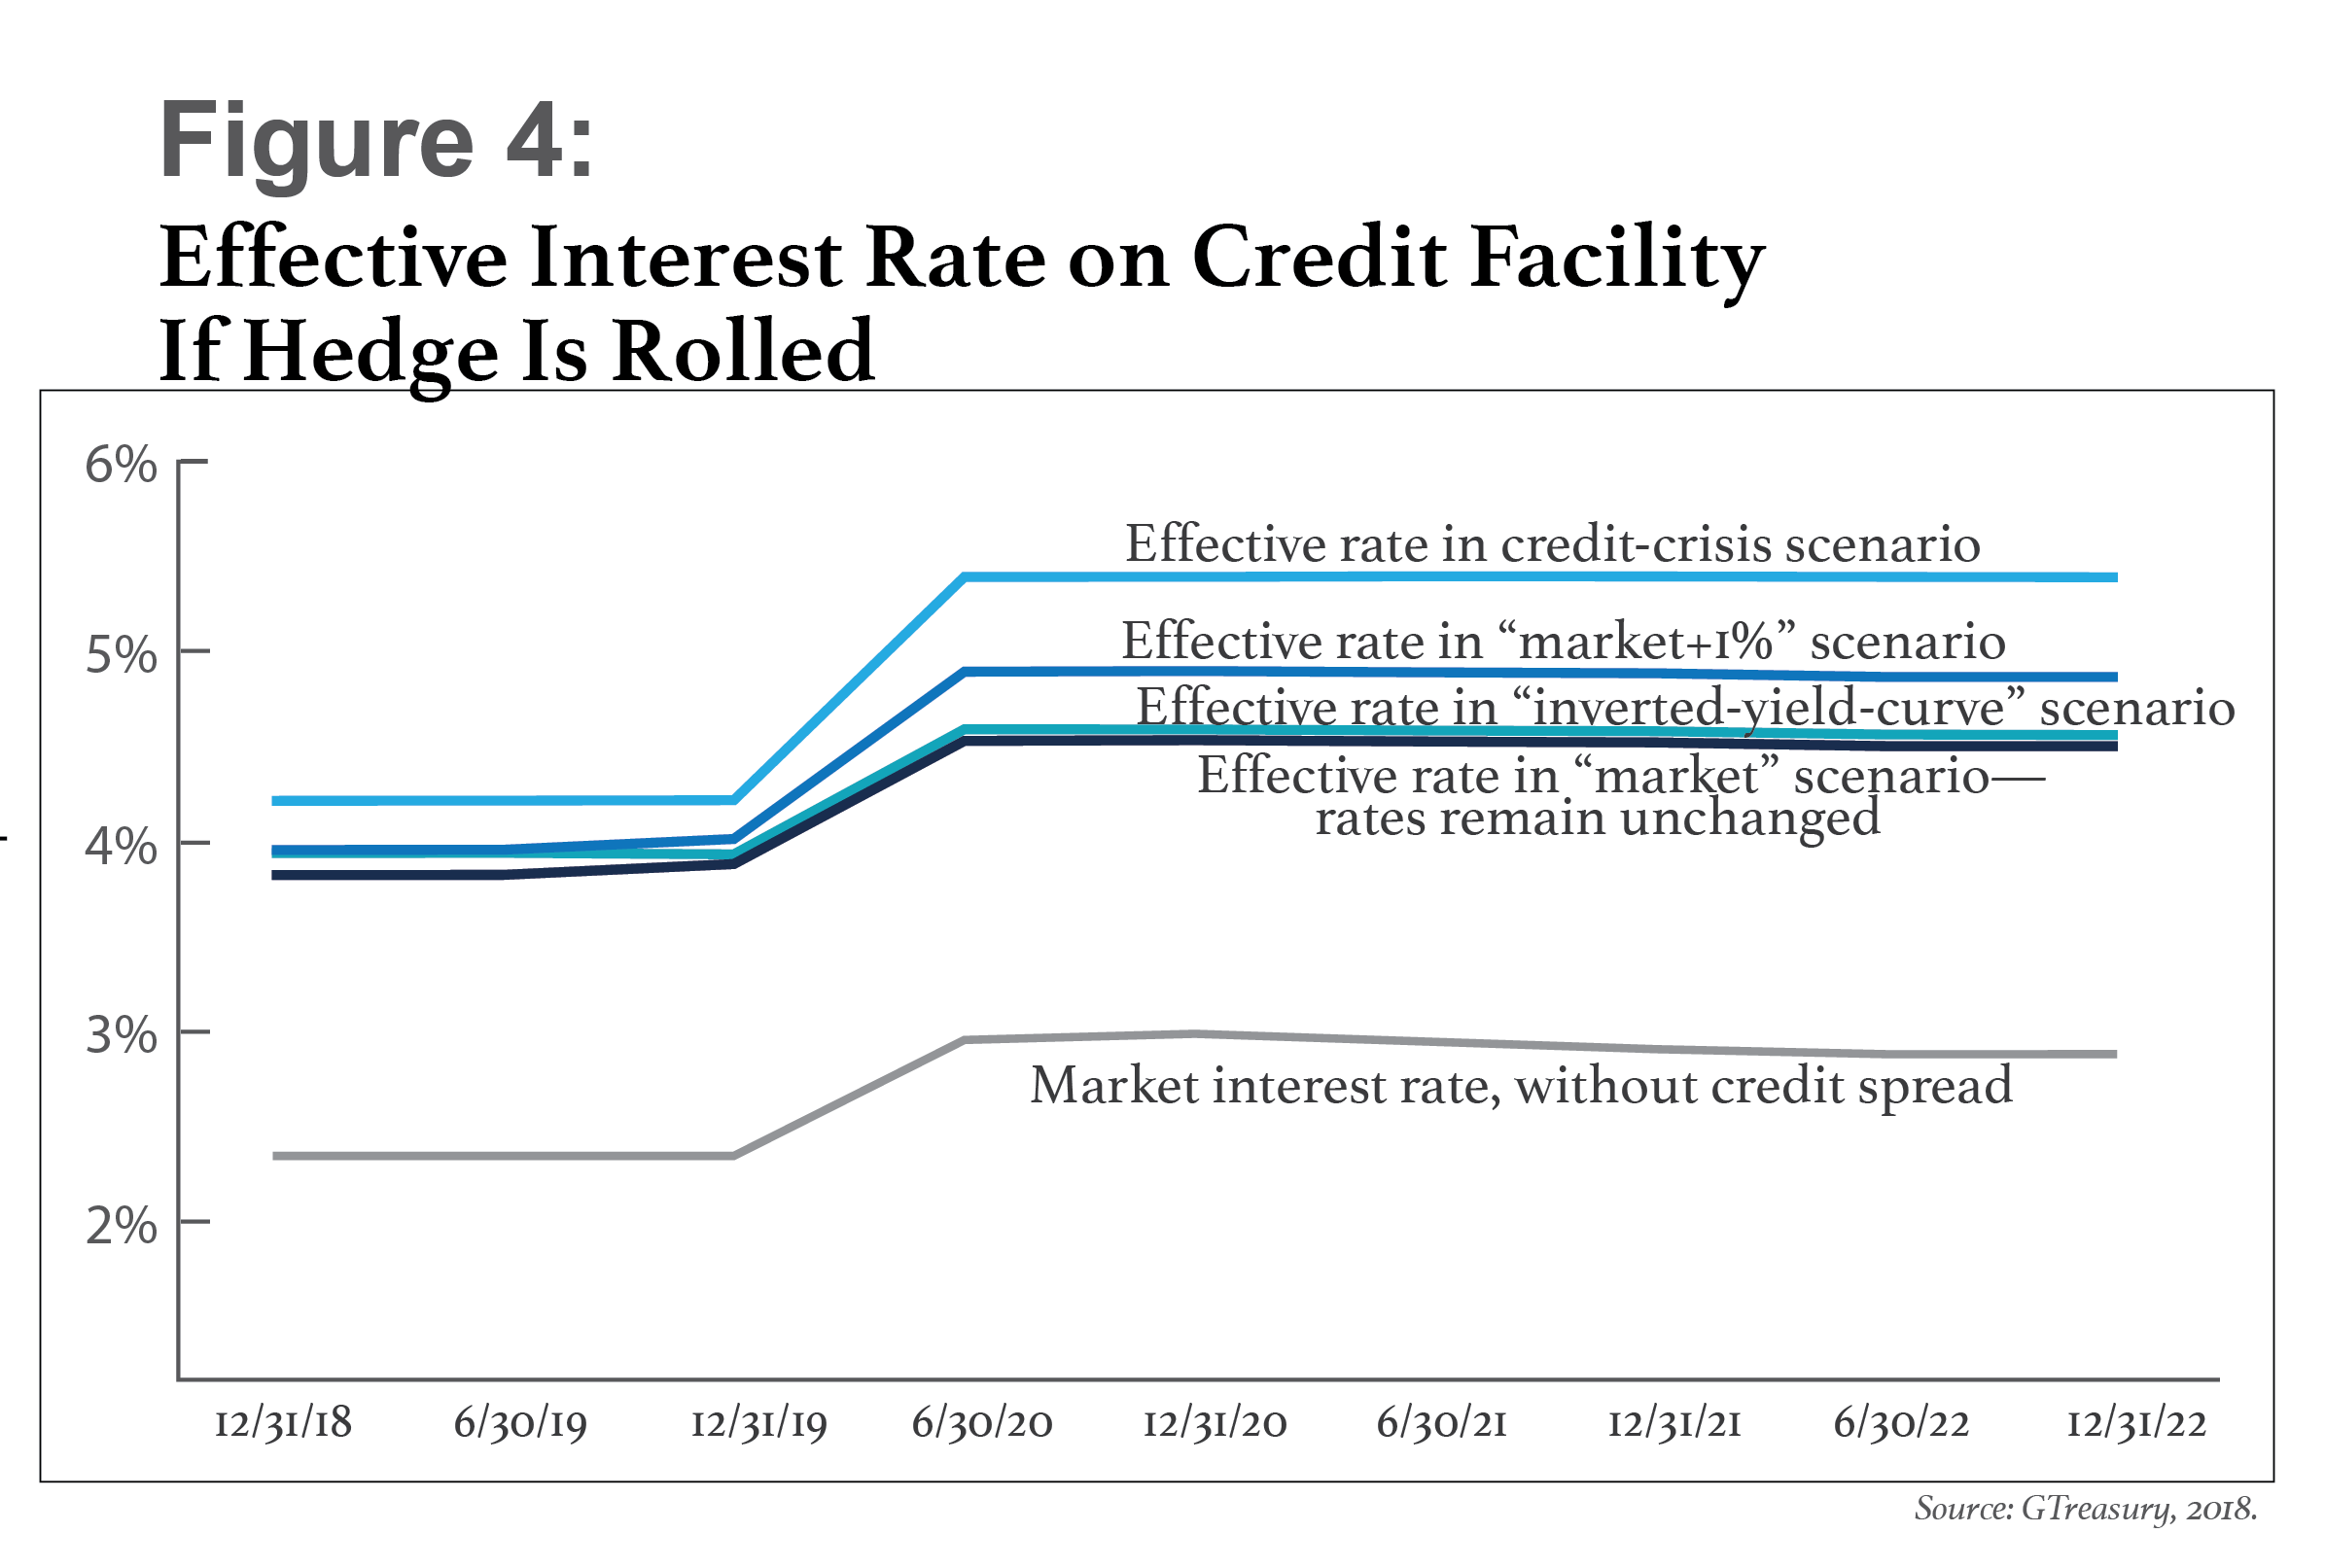
Hedging provides the most benefit if rates follow either the“market+1%” or credit-crisis path. In the “market+1%” scenario, therate on the credit facility in April 2020 and beyond is 5.5 percentwithout a hedge (Figure 3) but 4.8 percent with a hedge (Figure 4).And in the credit-crisis scenario, an unhedged facility would carryan effective rate of 6.9 percent, whereas the effective rate with ahedge is 5.4 percent. In these scenarios, hedging a $500 millioncredit facility provides an annual savings on interest costs of$3.5 million to $7.5 million.
|Hedging under the inverted-yield-curve scenario provides lessbenefit, as the impact is on the near end of the curve and theexisting swap provides cover to the end of 2019. Without the hedge,the facility's effective interest rate ranges from 4.72 percent inJune 2020 to 4.63 percent in December 2022, whereas with the hedgethe rate stays between 4.55 percent and 4.58 percent throughout thefacility's term. If yield curve inversion were associated withhigher longer-term rates, then the benefit will be greater. Thus,hedging would result in a cost savings in the inverted-yield-curvescenario in Figures 3 and 4, but on a much smaller scale than inthe “market+1%” or credit-crisis scenarios.
|If the current rates don't change at all—our “market”scenario—the effective interest rate is 4.5 percent, whether or notthe company hedges. Thus, entering into a three-yearforward-starting fixed-for-floating interest swap would have noimpact on the company's effective rates; the hedge would simplyconvert current market floating rates into their fixedequivalent.
|Once the treasury team has assessed the impact of each scenario,they can make judgments about the likelihood that each scenariowill come to pass. They can also run calculations on variationsaround each scenario—for example, determining the impact if marketrates were to increase by 0.75 percent, rather than 1 percent.
||
Assessing Reasonableness
The next step is to assess how the scenarios fit into the rangeof all possible outcomes drawn from a simulation approach. Eventhough we can apply subjective probabilities to possible outcomes,our subjectivity may be biased when compared with the range ofsimulated outcomes based on historical volatilities and randomsimulations. In other words, our beliefs about the likelihood ofeach scenario may not be accurate. Recent press speculation aboutyield curve inversion and a “Powell put” that would result in fewerinterest rate increases in 2019 shows how quickly prevailing viewscan change.
|A statistical simulation of future three-month LIBOR rate pathsenables the treasury team to assess the likelihood of differentoutcomes and then compare against their own subjective estimates oflikelihood. In Figure 5, we've started with the July 2018three-month LIBOR of 2.34 percent, then run simulations from thatrate. The dark, medium, and light blue shaded values correspond to1, 2, and 3 standard deviations. Note that this analysis does notinclude the 150 bps credit spread because it is a constant.However, the credit spread will need to be added back for purposesof comparing the scenario outcomes to the simulation.
|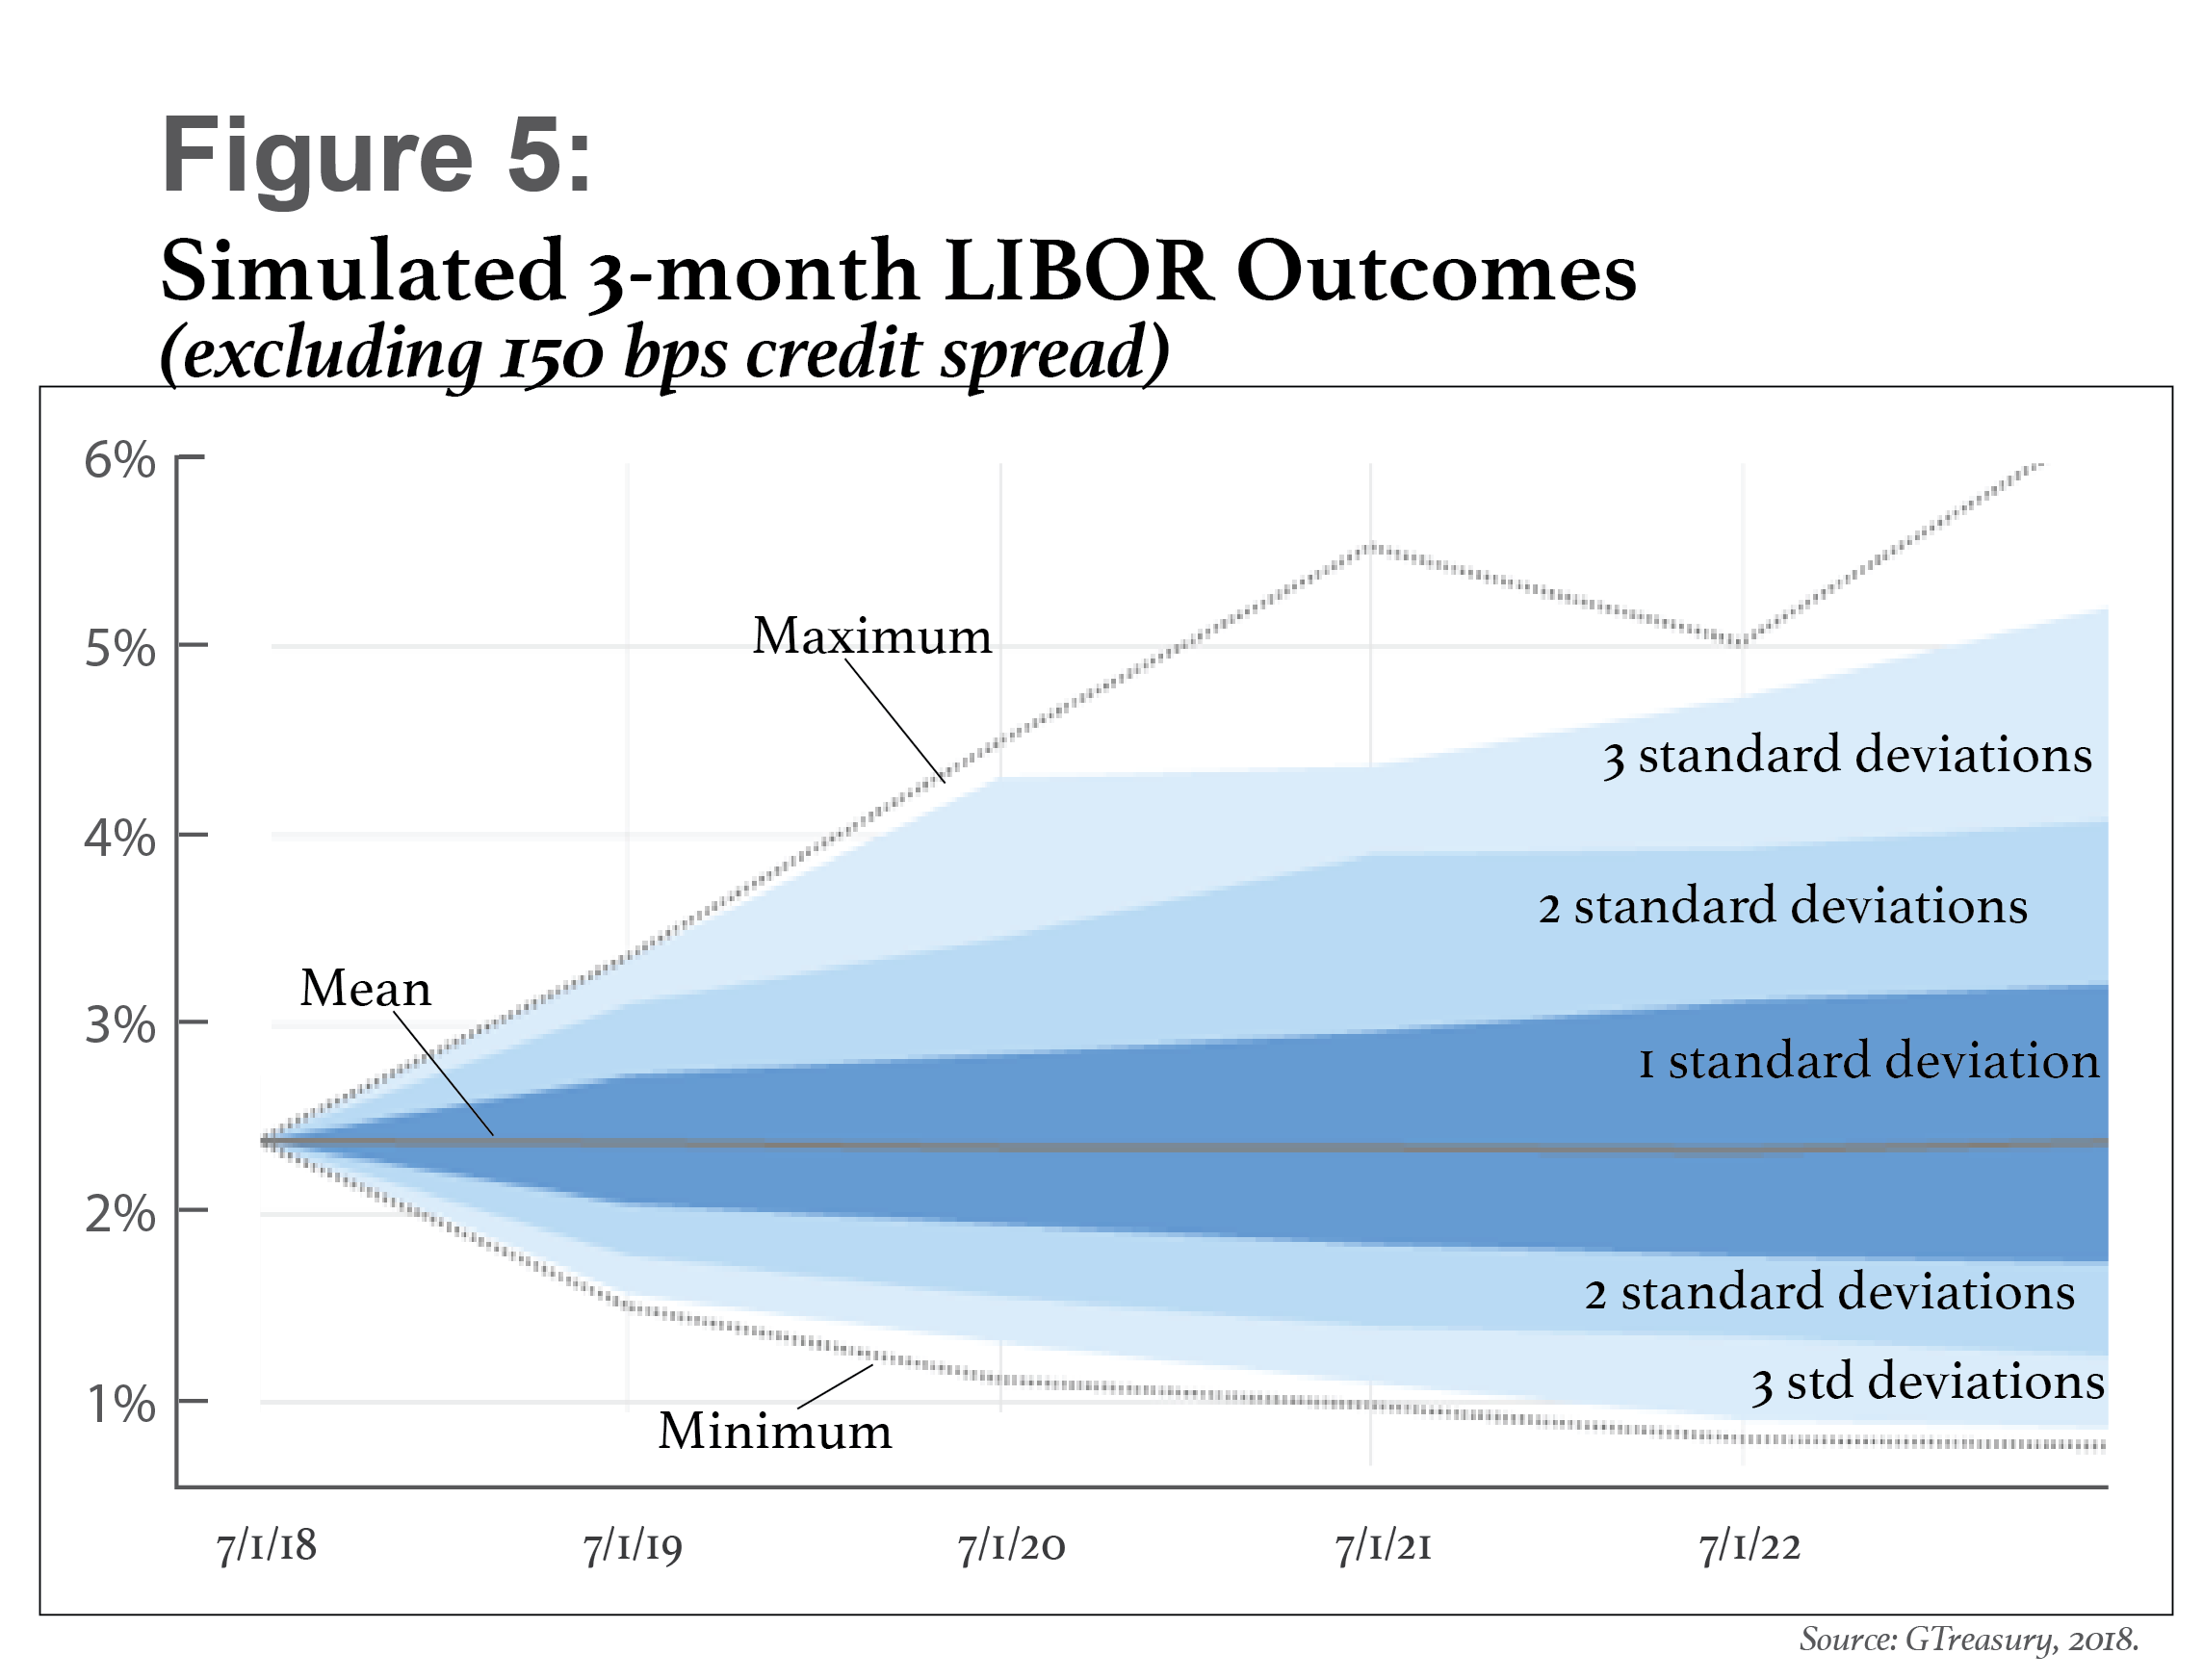
A treasury team that runs a statistical simulation like that inFigure 5 can then compare the outcome against their subjectiveassessment of the likelihood of different interest rate scenarios.For example, the interest rate under the 2 standard deviation(medium blue) calculation is about 4 percent in December 2022,which corresponds closely with the “market+1%” scenario: In Figure3, the effective rate without a hedge is 5.46 percent in December2022, which equals a 4 percent three-month LIBOR plus the 1.5percent credit spread. This corresponds to the two-sided 5 percentconfidence interval. The credit-crisis scenario—which would involvea three-month LIBOR (effective interest rate without hedge, minuscredit spread) of 5.3 percent by December 2022—is even lesslikely.
|Figure 5 shows that the most likely outcome is a rate increaseof between 0 and 1 percent.
||
Be Prepared
As the Federal Reserve continues to raise interest rates, thetime has come for treasury teams throughout corporate America tostart assessing and planning for hedging as they consider thefuture of credit facilities due to roll over in the next couple ofyears. There will be an inescapable increase in effective interestcosts when facilities roll, regardless of a company's hedgingstrategy. And that cost will increase if LIBOR continues torise.
|This doesn't mean, however, that there's nothing treasury can doto mitigate the impact of rising rates. Treasury professionals canquantify the increased interest cost within a variety of differentscenarios, both with and without hedging. They can then assess eachscenario for “reasonableness” against a set of randomly simulatedscenarios. Such an analysis provides a sound basis for assessingand acting.
|In September, the Fed appeared to be planning on three rateincreases in 2019. More recently, some have predicted that the increases willcome more slowly, due to slowing economic growth around the worldand volatility in the financial markets. Regardless, most Fedwatchers expect rates to continue to rise in the short term. Thatmeans the time to prepare is now—not when facilities mature.
|
 Peter Seward is thevice president of market development and risk for GTreasury. He isresponsible for helping prospective corporate treasuryclients understand how to apply technology to better managerisk and its impact on cash. An early pioneer ofsoftware-as-a-service (SaaS) treasury technologies, Sewardregularly shares his expertise as an author and speaker.
Complete your profile to continue reading and get FREE access to Treasury & Risk, part of your ALM digital membership.
Your access to unlimited Treasury & Risk content isn’t changing.
Once you are an ALM digital member, you’ll receive:
- Critical Treasury & Risk information including in-depth analysis of treasury and finance best practices, case studies with corporate innovators, informative newsletters, educational webcasts and videos, and resources from industry leaders.
- Exclusive discounts on ALM and Treasury & Risk events.
- Access to other award-winning ALM websites including PropertyCasualty360.com and Law.com.
*May exclude premium content
Already have an account? Sign In
© 2024 ALM Global, LLC, All Rights Reserved. Request academic re-use from www.copyright.com. All other uses, submit a request to [email protected]. For more information visit Asset & Logo Licensing.