 The cash that companies carry on their balance sheets istypically divided into three categories: working capital,liquidity, and strategic cash. Working capital is the cash neededto fund day-to-day operations. Liquidity is cash that anorganization keeps on hand to meet an unexpected shortfall inworking capital. Businesses traditionally have held their workingcapital funds in bank accounts and held the cash designated forliquidity in prime money market funds, which deliver low yields butoffer withdrawal at any time.
Strategic cash is the cash left over after the first two bucketsare filled. Strategic cash is typically held as a buffer againstunanticipated needs like a major acquisition or facility build-out,as well as to strengthen the balance sheet. Liquidity is definitelya concern for strategic cash holdings, but companies tend to seekout somewhat higher returns than they get on their working capitaland liquidity. So cash in the “strategic” bucket is usuallyinvested in bonds—typically corporate or agency securities withmaturities inside five years.
|Before the 2008 crisis in the financial markets, many companiesworked to minimize the amount of cash in their working capital andliquidity accounts, in favor of higher-yielding strategic cashaccounts. Then, in the immediate aftermath of the financial crisis,preferences experienced a dramatic reversal. The bankruptcy ofLehman Brothers and the subsequent failure of the Reserve Primarymoney market fund caused corporate investors to flee strategiccash, which was suddenly perceived as unacceptably risky, for thesafety of bank deposits. According to the Federal Reserve,institutional money fund balances declined by 30 percent betweenAugust 2008 and the end of 2012.
|Today, the pendulum is swinging back in the other direction.Strategic cash reserves are growing as companies are again pursuingreturns on their cash holdings. Several factors have been drivingthis trend; they all start with financial regulations.
||
Regulatory Response to the Crisis
|Among the many responses to the 2008 financial crisis fromgovernment entities, both domestically and abroad, two inparticular have impacted corporate cash investments. The first ismoney market fund reform. When losses caused the ReservePrimary fund to “break the buck”—i.e., for per-share net assetvalue (NAV) to drop below $1—money market investors panicked. Manyfunds were forced to turn to their parent companies for cashinfusions as assets went out the door. So the Securities andExchange Commission (SEC) changed the rules for money market funds.Starting on October 14, 2016, institutional prime and municipalmoney market funds will no longer trade at a fixed $1 per sharevalue; instead, the NAV will float, directly reflecting the value of theunderlying assets.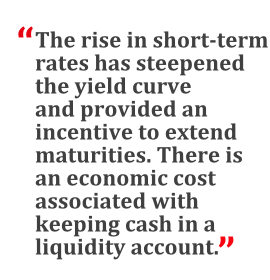
The second major regulatory change is the liquidity coverageratio (LCR), which came into existence as part of the Basel IIIbanking sector reforms. To quote the Bank for InternationalSettlements: “The LCR promotes the short-term resilience of abank's liquidity risk profile. It does this by ensuring that a bankhas an adequate stock of unencumbered high-quality liquid assets(HQLA) that can be converted into cash easily and immediately inprivate markets to meet its liquidity needs for a 30-calendar-dayliquidity stress scenario.”
|This impacts corporate cash investing because of the way the newregulatory regime treats certain bank deposits. Large demanddeposits made by institutional investors are essentially considered“hot” money. The Bank for International Settlements assumes thesewill be the first funds out the door if a bank runs into trouble.As a result, the new rule requires that banks hold a large amountof high-quality liquid assets, such as Treasuries, to backinstitutional investors' demand deposits—scaling up from 60 percentof these deposits' total value in 2015 to 100 percent by 2019.Thus, the liquidity coverage ratio makes corporate deposits veryexpensive for banks to hold.
||The combination of money fund reforms and the liquidity coverageratio is resulting in a cash crunch for corporate liquidityaccounts. Many corporate investment policies stipulate that theonly mutual fund investments that are permissible for corporatecash are shares of a money market fund with a fixed, $1-per-shareNAV. Frequently, this language is echoed in control agreements,debt covenants, and a host of other legal documents that govern what a corporation can do with surplus cash.
| Amending these legal documents is a difficult andtime-consuming process, so a common response to the new structureis to seek an alternative to prime money market funds, a differenttype of fund that can guarantee the company a $1-per-share NAV. Onepossibility is investing in certain government or Treasury-onlyfunds. The problem with these funds is that demand for short-term Treasury and agency paper is extremelyhigh right now, which has driven rates down to the floor. At best,most Treasury and government funds are now yielding 1 basis point(0.01 percent).
If the money fund reforms were the only regulatory changecompanies were facing, many corporate investors would turn to bankdeposits to stash their cash. However, because the Basel IIIliquidity coverage ratio has made corporate deposits costly forbanks, banks no longer find these deposits very attractive. Bankshave aggressively cut interest rates, and anecdotal evidencesuggests that some institutions are actively seeking to discouragedeposits of corporate cash.
||
The Fed: Changing Tack
|Although the Basel III and money fund changes have been on thehorizon for some time, many companies are just starting to grapplewith their impact on corporate cash management. And nowexpectations about interest rates are further complicating theliquidity picture.
|Since the fourth quarter of 2008, the Federal Reserve has held the overnight federal funds rate atzero. At the same time, the central bank has undertaken aseries of “extraordinary measures” in order to bring down not justthe overnight rate, but rates across the entire yield curve. Themost significant of these programs appears to have been the threerounds of quantitative easing (QE) that the Fed ended in October of lastyear.
|Now the Fed is issuing communications designed to prepare marketparticipants for an increase in the federal funds rate. The Fed has clearlystated that its rate changes will be data-dependent, and mostanalysts expect the first rate hike to occur sometime later thisyear. The bond market already reflects this expectation: The yieldon two-year Treasuries more than doubled over the past three years,from 0.20 percent on May 2, 2012 to 0.66 percent on July 31, 2015,while the yield on three-year Treasuries rose 68 basis points, from0.29 percent to 0.97 percent, in the same period.
|The rise in short-term rates (i.e., rates on bonds with a tenorshorter than three years) has steepened the yield curve andprovided an incentive for investors to extend maturities. Thisunderscores the fact that there is an economic cost associated withkeeping cash in a liquidity account: forgone income.
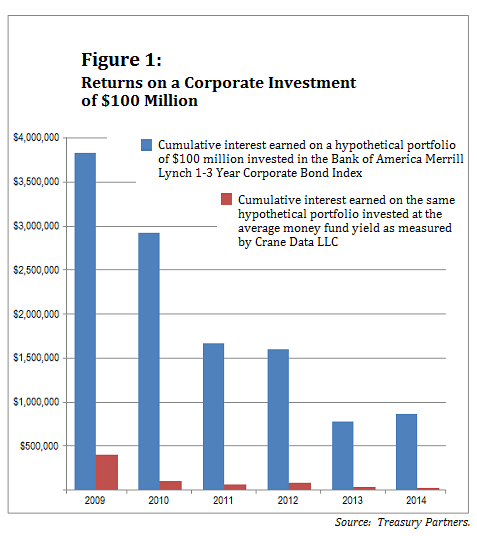
|According to Crane Data, the average annual return on a primemoney market fund for the period December 31, 2012 through December31, 2014 was 3 basis points. On a $100 million dollar investment,interest would have totaled roughly $60,000 for the two years. Bycontrast, the yield on two-year Treasuries on December 31, 2012 was25 basis points. The same $100 million, invested in two-yearT-bills, would have generated $500,000 in income over the same timeperiod. So the cost of keeping cash in a prime money fund, insteadof a two-year Treasury bond, was $440,000 over those two years. Thedifference is even more pronounced when money fund returns arecompared with corporate bond funds; see Figure 1, below.
|
Investors Move
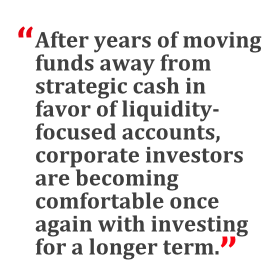
|The convergence of these forces has triggered a change inbehavior among corporate treasury managers. After years of movingfunds away from strategic cash in favor of liquidity-focusedaccounts, corporate investors are becoming comfortable once againwith investing for a longer term, primarily in corporate andmunicipal bonds, with some agency debt as well. For the most part,these changes are occurring within the context of companies'pre-existing investment policies; companies are electing to startfunding strategic cash accounts again, drawing down money fundbalances.
| Most corporate portfolios fall into one of four categoriesin terms of investment type: They contain only U.S. Treasury bonds,a combination of Treasuries and agency bonds, only corporate notes,or only municipal debt. Because Treasuries are theoreticallyrisk-free, the Treasuries-only portfolio is the most conservativeoption.
While some corporate investment policies allow only Treasuries,many more also allow investment in agency debt. Spreads for agencybonds remain attractive relative to Treasuries, especially forcallable agency bonds. In fact, spreads are attractive enough thatin some cases, a company may want to have agencies in its portfolioeven if its investment policy allows for corporate bonds andinstitutional certificates of deposit (i.e., CDs that are notfederally insured).
|Municipal securities are typically purchased by investorsseeking to maximize after-tax returns. The most significantdifference between the pre- and post-crisis era is the virtualdisappearance of bond insurance. Before the crisis, third-partyinsurance covering interest and principal payments on municipaldebt was widely used to boost credit ratings and thereby widen theinvestor base. Now that this insurance is no longer widelyavailable, the typical municipal investor is doing the requisitehomework and so has paradoxically become more willing to add to itsportfolio securities with lower—single- or double-A—ratings.
|Portfolio Laddering to Increase Yield
|Regardless of which vehicles a company's investment policyallows, the best practice in cash management requires the treasuryfunction to ladder the portfolio. Laddering is a technique in whicha portfolio is structured with funds allocated evenly toconsecutive maturity tranches. So, for example, a $100 millionportfolio might be invested so that $50 million matures within 12months and another $50 million matures between 12 and 24 monthsfrom now.
|This approach ensures that funds will be available, throughnatural maturities, to reinvest at higher yields if rates continueto rise. As rates begin to rise, we expect most portfolios to stayon the shorter-dated side, with weighted-average maturities ofaround 18 months and stated final maturities of 36 months.
|The onset of the 2008 financial crisis was a tremendous shock tocorporate cash investors. They responded to the shock in part bymoving funds from strategic cash into liquidity accounts. Sevenyears later, memories of the shock have faded and been replaced byconcerns about regulatory changes and forgone yields. The resulthas been a shift back into strategic cash. We expect this trend tocontinue throughout 2015 as short-term rates rise and regulatorychanges bite deeper.
|———————————–
| Jerry Klein is a managing director/partner atHighTower at Treasury Partners in New York.
 Brendan Jones is an executive director atHighTower at Treasury Partners in New York. He is the portfoliomanager for the firm's Corporate Cash Managementpractice.
Complete your profile to continue reading and get FREE access to Treasury & Risk, part of your ALM digital membership.
Your access to unlimited Treasury & Risk content isn’t changing.
Once you are an ALM digital member, you’ll receive:
- Critical Treasury & Risk information including in-depth analysis of treasury and finance best practices, case studies with corporate innovators, informative newsletters, educational webcasts and videos, and resources from industry leaders.
- Exclusive discounts on ALM and Treasury & Risk events.
- Access to other award-winning ALM websites including PropertyCasualty360.com and Law.com.
*May exclude premium content
Already have an account? Sign In
© 2024 ALM Global, LLC, All Rights Reserved. Request academic re-use from www.copyright.com. All other uses, submit a request to [email protected]. For more information visit Asset & Logo Licensing.